
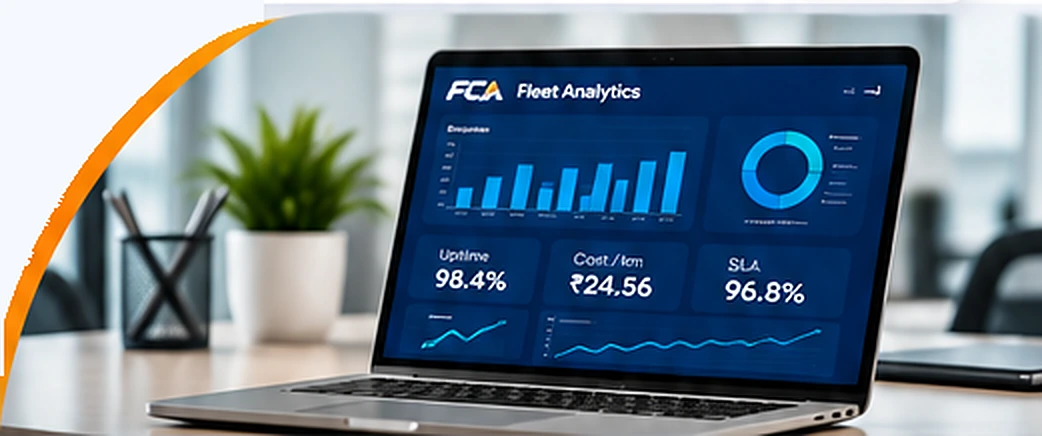
Fleet MIS Reporting and Analytics Services
See your fleet clearly — uptime, cost and vendor performance in one report.
FCA provides fleet MIS reporting services for corporate, leasing and logistics fleets in India: dashboards and Power BI reports on uptime, cost per km, downtime, vendor SLAs and utilisation, delivered weekly or monthly. Reports are built and run from our Indore desk for fleets anywhere in India. Call +91 77469 38622 or send the enquiry form to get a proposal.
Published by Fleet Care Assist 24x7 · Last updated
The challenge
The problem we solve.
Without consolidated data, fleet decisions get made on gut feel instead of numbers.
Best for
- Corporate fleets
- Leasing companies & OEMs
- Logistics & transport
Fleet O&M
What FCA does
- Data-driven fleet performance insights
- KPI dashboards for uptime, cost and SLA adherence
- Power BI reporting for management review
- Vendor and workshop performance tracking
- Cost-per-km and downtime analysis
- Custom reporting cadence (weekly/monthly)
Who it's for
Who uses fleet analytics & MIS
Corporate fleets
- A monthly MIS on cost per km and downtime for management review
- Finding high-cost vehicles that are due for replacement
- Comparing vendor and workshop performance across cities
Logistics and transport operators
- Utilisation and breakdown frequency by vehicle and route
- Fuel and maintenance cost trends by vehicle group
- Tracking mean time to repair at each workshop
Hospitals and ambulance operators
- Ambulance uptime and off-road days by vehicle
- Vendor SLA adherence for servicing and repairs
- Reports for management or contract reviews
Options
| Option | What it covers | Suits |
|---|---|---|
| MIS dashboard | Core KPIs such as uptime, cost per km, downtime and utilisation in one view | Fleets that need a regular snapshot |
| Power BI report | Interactive report built on your fleet data for management review | Teams already using Power BI or Microsoft 365 |
| Excel MIS report | Structured Excel report in a fixed format | Fleets that circulate reports by email |
| Vendor and workshop scorecard | SLA adherence, repair time and cost by vendor | Fleets with several service vendors |
| Periodic performance review | Weekly or monthly review of trends, outliers and actions | Management teams that want decisions, not just data |
Reporting options
Deliverables
What you get.
MIS dashboard
Power BI report
Periodic performance review
Our process
How it works.
Step 1: Enquiry
Tell us how many vehicles you run, where the data sits today (Excel, GPS platform, fuel cards, workshop bills) and who reads the reports.
Step 2: Assessment
We review a sample of your data, agree the KPIs and definitions, and point out gaps such as missing odometer readings. Agreeing definitions first keeps cost per km and uptime consistent month to month.
Step 3: Deployment
We build the MIS dashboard or Power BI report on your data and set the reporting cadence, weekly or monthly. You review a first version before it becomes the standard format.
Step 4: Monitoring
Each cycle, new data is checked for missing or odd entries before it goes into the report. Outliers such as a sudden jump in cost per km are flagged with the likely cause.
Step 5: Reporting
You receive the report on the agreed day, with a short note on what changed and what needs action. A periodic review meeting can go through vendors, high-cost vehicles and downtime.
Coverage
Coordinated 24×7 from FCA's desk in Indore, Madhya Pradesh, with a verified partner network for work in other states. See fleet analytics & MIS in Indore or multi-state operations.
Compliance and standards
- Your fleet data is used only to prepare your reports, and access is limited to the people you name.
- KPI definitions, such as how cost per km and uptime are calculated, are written down and agreed before the first report so figures can be audited.
- Driver-level data is shared only with the people the client authorises.
Why FCA
- Reports are built by a team that runs fleets and ambulances day to day, not only by analysts.
- Founder Mahendra Singh Meena has 12+ years in fleet operations, ambulance management and healthcare mobility.
- Excel and Power BI delivery, so reports fit tools your team already uses.
- A 24x7 Indore desk, with fleets anywhere in India supported through a verified partner network.
FAQs
Common questions about fleet analytics & MIS
What KPIs does FCA track in fleet analytics reporting?
We track vehicle uptime, cost-per-km, mean time to repair, vendor SLA adherence, breakdown frequency and fleet utilisation. Reports are delivered weekly or monthly in formats the management team can act on.
Does FCA build Power BI dashboards for fleet management?
Yes. We design Power BI reports tailored to the organisation's fleet data, covering operational performance, vendor metrics and cost trends — so leadership gets a live view without chasing spreadsheets.
How does fleet analytics help reduce operating costs?
By surfacing cost-per-km outliers, underperforming vendors and high-downtime vehicles, analytics allows targeted interventions instead of blanket spend.
How do you calculate cost per km for a fleet vehicle?
Cost per km is the total cost of running a vehicle over a period divided by the kilometres it ran in that period. Total cost usually includes fuel, maintenance and repairs, tyres, insurance and, if you choose, driver and lease or depreciation costs. We agree which costs to include at the start so the figure stays comparable over time.
What data do we need to share to start fleet MIS reporting?
At minimum, we need a vehicle list, odometer or GPS kilometre data, fuel records and maintenance or repair bills. Breakdown logs, vendor invoices and driver rosters add depth to the reports. If some data is missing, we start with what you have and show where the gaps are.
What should a vehicle MIS report format include?
A vehicle MIS report should show each vehicle's kilometres, cost per km, fuel use, downtime days, breakdowns and pending renewals for the period. A summary on top shows fleet totals and the vehicles that need attention. We adapt the format to what your management team reviews.
Can FCA use data from our existing GPS or telematics system?
Yes, if the system can export data, we can use it in your reports. Most platforms allow exports to Excel or CSV, which we combine with fuel and maintenance records. We do not need you to change your GPS provider.
Do we need a Power BI licence to view the reports?
It depends on how the report is shared. Some sharing options in Power BI need licences for viewers, while an Excel version or a PDF export does not. We suggest the delivery format based on the tools and licences your team already has.
How often should fleet MIS reports be reviewed?
Most fleets review a full MIS monthly, with a short weekly view of downtime and open repairs. Weekly checks catch problems while they can still be fixed. Monthly reviews show cost trends and vendor performance more clearly.
Need fleet analytics & MIS?
Tell us your fleet size, cities and what you need. We reply with a written quote.
Get a quote